
« Back to AP Physics Guide / Unit 6 Part 1: Springs & Pendulums
AP Physics 1: SHM Graphs & Energy
In Part 1, we calculated the Period ( ). Now, we look at exactly where the object is and how fast it is moving at any given second. To do this, we use the sinusoidal graphs of motion and the principles of energy conservation. AP Physics 1 CED Unit 7: Oscillations (Topics 7.2–7.4, 5–8% exam weight).
1. Position, Velocity, and Acceleration
Because the restoring force ( ) changes as the object moves, the acceleration is not constant. We cannot use the standard kinematics equations (the “Big 4”). Instead, the motion follows a sine or cosine pattern.

The Phase Shift: Notice that when Position is at a maximum peak, Velocity is zero. Acceleration is always exactly opposite to Position.
Reading the Graphs (The “Extremes”):
- At Amplitude (
 ):
):
- Velocity (): Zero (the object stops momentarily to turn around).
- Acceleration (): Maximum (the spring is stretched the most, causing max force).
- Velocity (
- At Equilibrium ():
- Velocity (): Maximum (speeding through the center).
- Acceleration (): Zero (the spring is relaxed, so no net force).
- Velocity (
 ):
):
 ): Zero (the object stops momentarily to turn around).
 ): Maximum (the spring is stretched the most, causing max force).
 ):
):
![\[x(t) = A\cos(\omega t), \quad v(t) = -\omega A\sin(\omega t), \quad a(t) = -\omega^2 A\cos(\omega t)\]](https://i0.wp.com/physicsqanda.com/wp-content/ql-cache/quicklatex.com-be8481a0aeb37123de60cadde447b758_l3.png?resize=482%2C22&ssl=1 "Rendered by QuickLaTeX.com")
 or
or  .
.
2. Energy in Simple Harmonic Motion
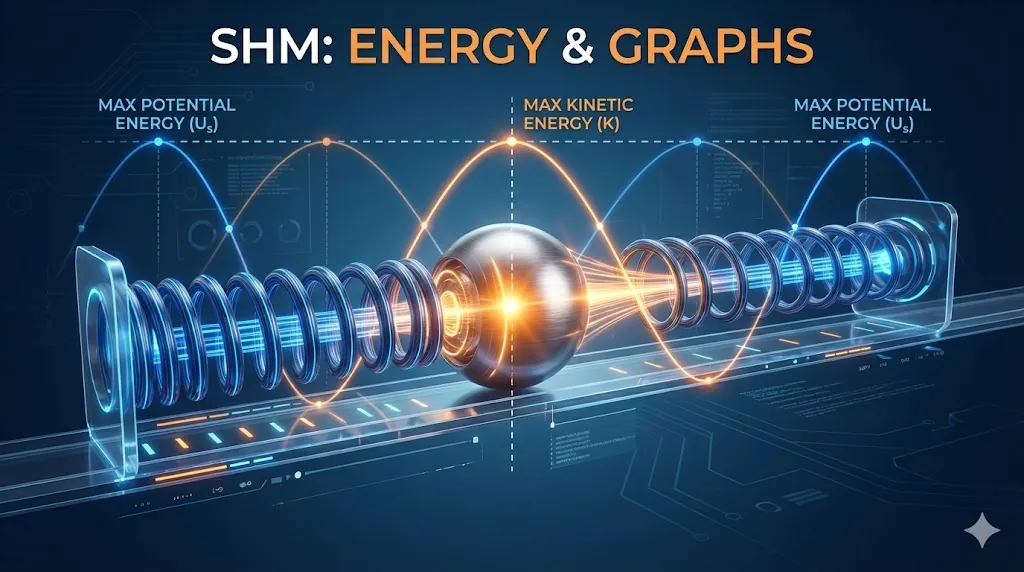
SHM is a perfect example of Conservation of Energy. Assuming no friction, the system constantly trades energy back and forth between two forms:
- Kinetic Energy (): Energy of motion (). Highest at equilibrium.
- Potential Energy (): Energy stored in the spring (). Highest at the endpoints (amplitude).
 ). Highest at equilibrium.
 ): Energy stored in the spring (
 ). Highest at the endpoints (amplitude).
 ![\[E_{total} = K + U_s = \text{Constant}\]](https://i0.wp.com/physicsqanda.com/wp-content/ql-cache/quicklatex.com-414d3b7d17107cd16bda04edfa28b901_l3.png?resize=217%2C15&ssl=1 "Rendered by QuickLaTeX.com")
![\[\frac{1}{2}kA^2 = \frac{1}{2}mv^2 + \frac{1}{2}kx^2\]](https://i0.wp.com/physicsqanda.com/wp-content/ql-cache/quicklatex.com-d4445001dae70a91f31c6ddf6fcb201c_l3.png?resize=171%2C36&ssl=1 "Rendered by QuickLaTeX.com")
 ) and spring stiffness (
 ).
).
We can visualize this exchange by plotting Energy versus Position ( ).
).

The Energy “Bowl”: Potential energy ( ) is a parabola highest at the “walls” (amplitude). Kinetic energy (
 ) is an inverted parabola highest at the “bottom” (equilibrium). Total energy is the flat dashed line across the top.
3. Quick AP Practice
📚 AP Practice Problems
1. An oscillator has a total energy of  . If you double the amplitude (
 ) of the oscillation, what happens to the total energy?
Answer
Total energy is proportional to the square of the amplitude ( ). Doubling means
  . The total energy becomes 4E.
2. Look at the Kinematics Graphs above. At time  , what is the state of the object?
Answer
At (half a cycle), the Position graph is at its most negative value ( ). The Velocity is zero. The Acceleration is at its maximum positive value.
3. At maximum velocity, what is the object’s acceleration?
Answer
Maximum velocity occurs at equilibrium ( ). Acceleration
  . Acceleration is zero.
🔗 Related AP Physics Resources
Unit 6 Complete!
You have mastered oscillations, periods, graphs, and energy conservation. Now it is time to spin. Next up is Unit 7.