
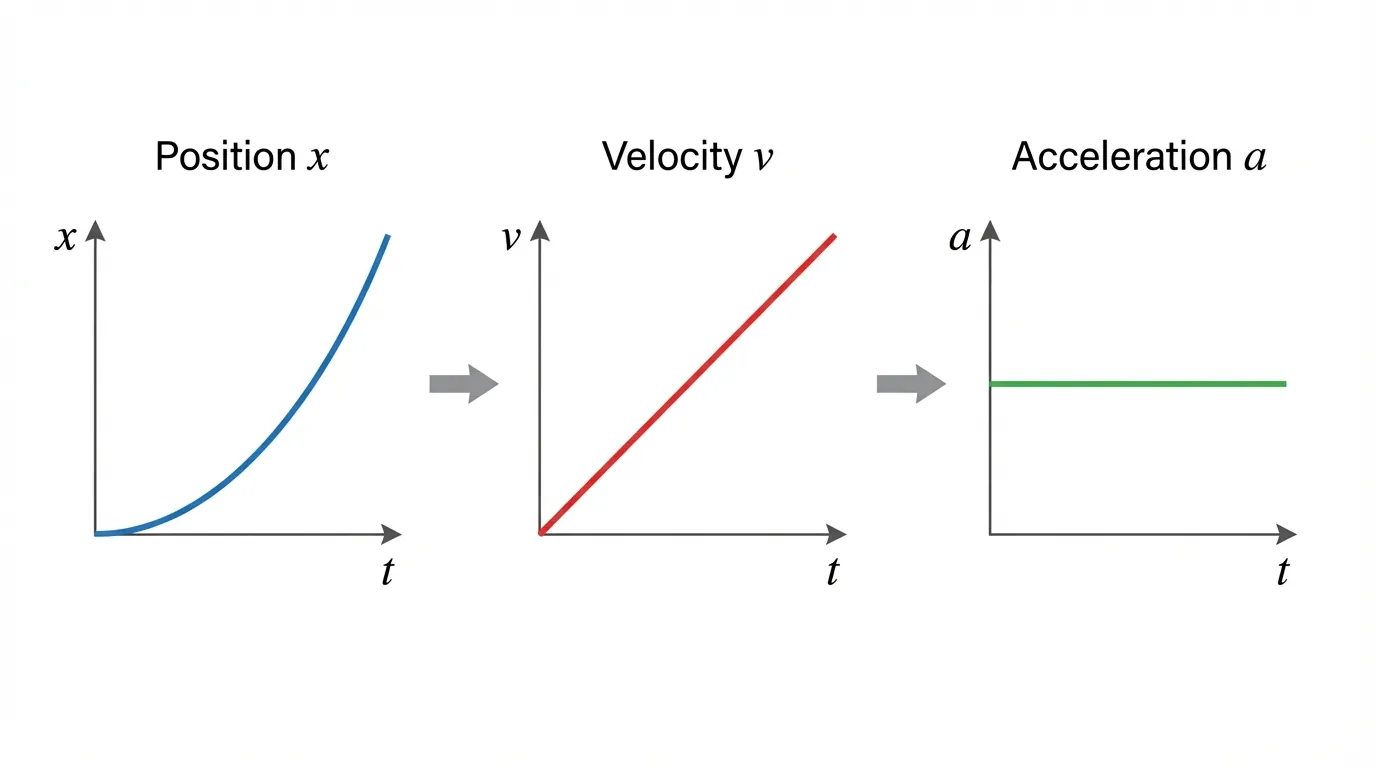

Learn how to interpret position–time (x–t) and velocity–time (v–t) graphs, determine velocity from slope, calculate displacement from graph area, and analyze motion visually using the same techniques required on the AP Physics 1 exam.
AP Exam Tip
Motion graph questions appear frequently in both multiple-choice and free-response sections of the AP Physics exam. Rather than memorizing graph shapes, understand what the slope and the area under the graph represent. These two ideas solve most graph-based questions.
Quick Summary
In the previous lesson, motion was described using the Big 4 Kinematics Equations. In this lesson, the same motion is represented visually using graphs. Motion graphs allow physicists to understand how an object moves without performing lengthy calculations.
Two graphs are especially important in AP Physics 1:
- Position–Time (x–t) Graphs show how an object’s position changes with time.
- Velocity–Time (v–t) Graphs show how an object’s velocity changes with time.
By interpreting the slope and area of these graphs, you can determine velocity, acceleration, and displacement, making graph interpretation one of the most valuable skills in kinematics.
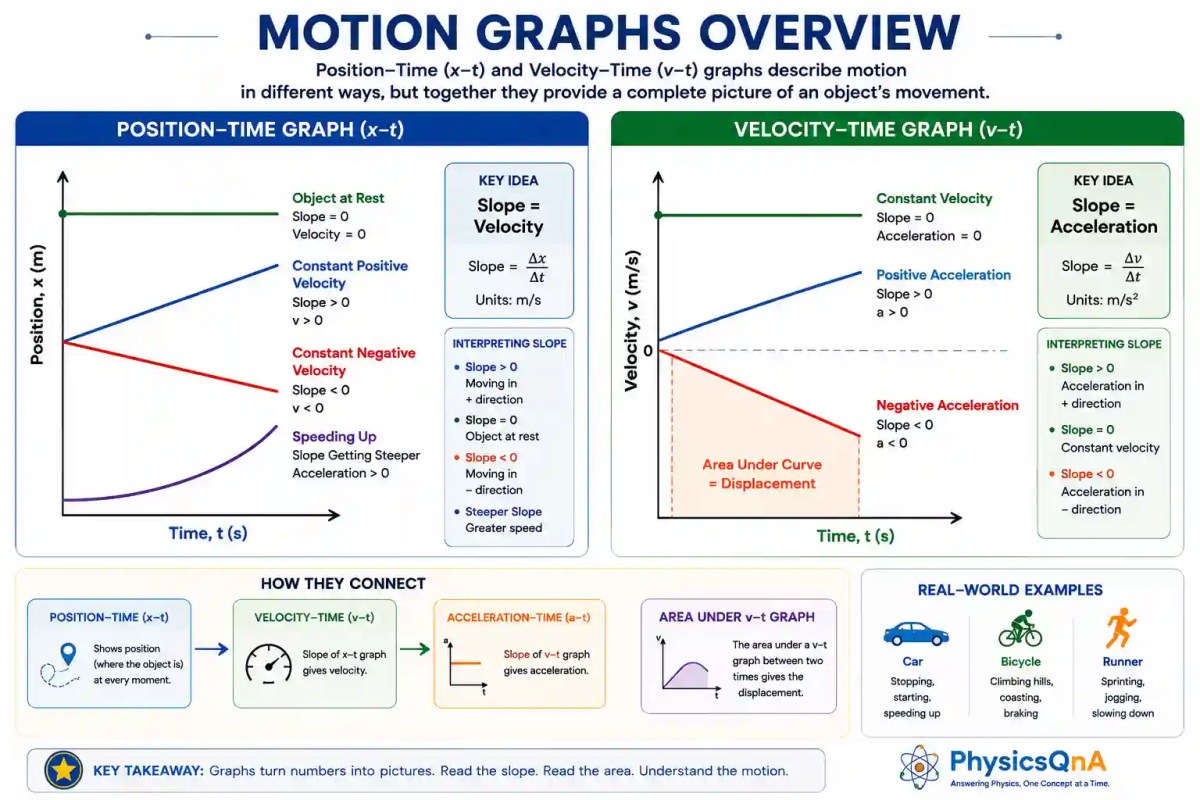
What You’ll Learn
By the end of this lesson, you will be able to:
Interpret Position–Time Graphs
Determine whether an object is moving forward, backward, speeding up, slowing down, or remaining at rest by analyzing the shape and slope of an x–t graph.
Calculate Velocity from Slope
Use the slope of a position–time graph to calculate both the magnitude and direction of an object’s velocity.
Interpret Velocity–Time Graphs
Recognize constant velocity, acceleration, deceleration, and changes in direction directly from a v–t graph.
Calculate Displacement from Area
Find displacement by calculating the area under a velocity–time graph using simple geometric shapes such as rectangles and triangles.
Why This Lesson Matters
Motion graphs are a bridge between mathematical equations and real-world motion. Engineers, scientists, and physicists use graphs to analyze everything from vehicle performance to rocket launches. Mastering x–t and v–t graphs will also make later topics such as projectile motion, Newton’s laws, and energy much easier to understand.
What Are Motion Graphs?
Imagine watching a car travel along a straight road. Every second, the car moves to a new position. Instead of describing its motion with a long list of numbers or repeatedly using equations, physicists organize this information into graphs. A motion graph transforms movement into a visual representation, making it much easier to recognize patterns, compare different types of motion, and solve problems.
In AP Physics 1, motion graphs are one of the most powerful tools for analyzing kinematics. By examining the slope and the area of a graph, important physical quantities such as velocity, acceleration, and displacement can often be determined without performing lengthy calculations.

Key Idea
A motion graph is not a picture of the object’s path. Instead, it is a graph that shows how a physical quantity such as position or velocity changes with time.
Common Misconception
Many students think that the shape of a graph represents the object’s actual path through space. This is incorrect. A curved graph does not necessarily mean the object is moving along a curved path—it simply shows how the measured quantity changes over time.
AP Exam Tip
Always read the graph axes before interpreting a motion graph. A graph with position on the vertical axis is analyzed differently from one with velocity on the vertical axis, even if their shapes appear similar.
Position–Time (x–t) Graphs
A position–time graph, often called an x–t graph, shows how an object’s position changes as time passes. It does not show the path that the object travels. Instead, each point on the graph tells the object’s position at a particular instant in time.
Think of the graph as a timeline of motion. As time moves from left to right along the horizontal axis, the graph records where the object is located relative to a chosen reference point called the origin.
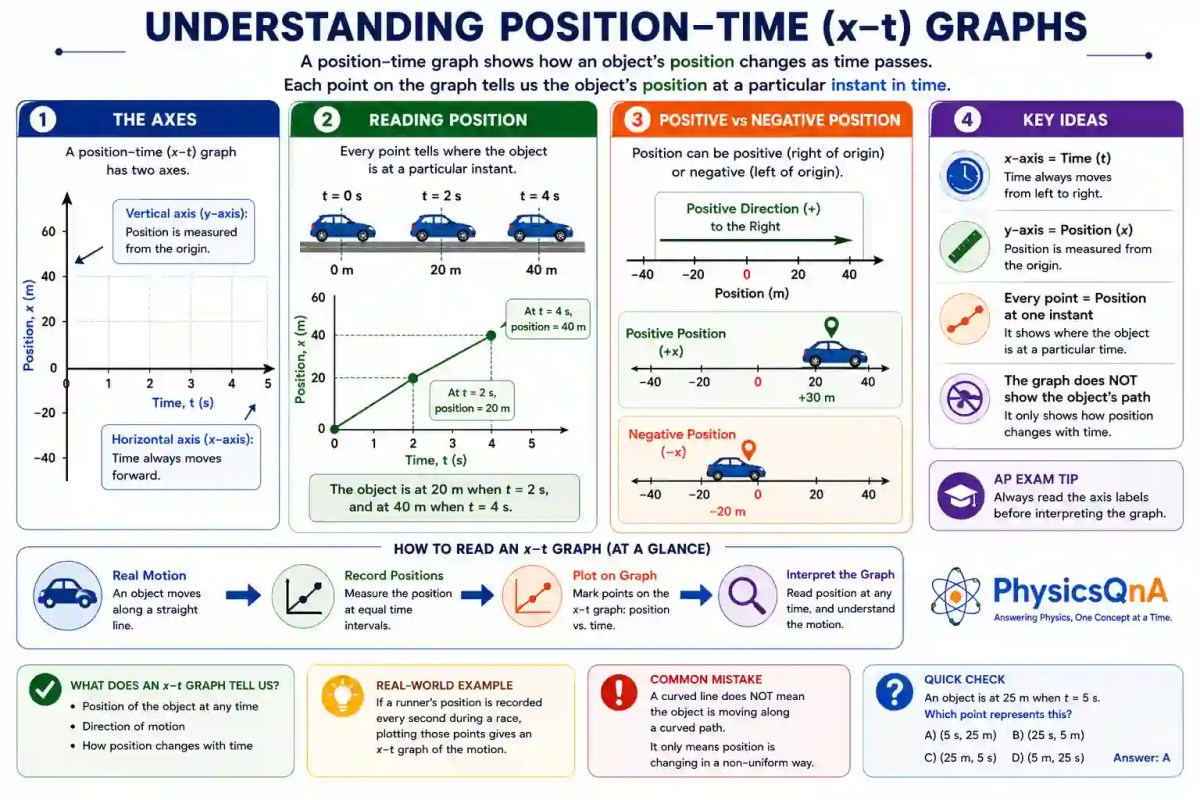
How to Read an x–t Graph
- Horizontal axis (x-axis): Time (t)
- Vertical axis (y-axis): Position (x)
- Each point: Position of the object at a particular time
- Moving upward: Increasing position
- Moving downward: Decreasing position
Real-World Example
Imagine recording the location of a runner every second during a race. Plotting those positions on a graph produces a position–time graph. The graph makes it much easier to see how the runner’s motion changes than reading a table of numbers.
Common Mistake
Many students assume the graph shows the road or path that the object follows. It does not. A position–time graph shows how position changes with time, not the shape of the object’s motion through space.
Concept Check
An object is located at 25 m when t = 5 s. On a position–time graph, which point represents this information?
- (5 s, 25 m)
- (25 s, 5 m)
- (25 m, 5 s)
- (5 m, 25 s)
Show Answer
Answer: A. Time is always plotted on the horizontal axis, while position is plotted on the vertical axis.
Slope of a Position–Time Graph = Velocity
The most important feature of a position–time (x–t) graph is its slope. The slope tells how quickly the object’s position changes with time, which is exactly the definition of velocity.
A steeper line represents a larger change in position over the same time interval, meaning the object is moving faster. The direction of the slope indicates the direction of motion.

Velocity from the Slope
For any two points on a position–time graph,
![\[ v=\frac{\Delta x}{\Delta t} \]](https://i0.wp.com/physicsqanda.com/wp-content/ql-cache/quicklatex.com-dc9e1825cc51b083c151bf1b5316aabd_l3.png?resize=60%2C38&ssl=1 "Rendered by QuickLaTeX.com")
where Δx is the change in position and Δt is the corresponding change in time.
Positive Slope
An upward-sloping line means the object’s position increases with time. The object moves in the positive direction, so its velocity is positive.
Zero Slope
A horizontal line means the position remains constant. Since the position does not change, the object is at rest and its velocity is zero.
Negative Slope
A downward-sloping line means the object’s position decreases with time. The object moves in the negative direction, giving a negative velocity.
Steeper Lines
The steeper the line, the greater the magnitude of the velocity. A shallow line represents slower motion.
AP Exam Tip
The value of the graph at a point gives the object’s position, while the slope at that point gives its velocity. These are different quantities and should never be confused.
Common Mistake
Students often assume that a higher point on the graph means a higher velocity. In reality, velocity depends only on the slope, not on how high or low the graph appears.
Concept Check
Which object is moving faster: one represented by a shallow upward-sloping line or one represented by a steep upward-sloping line?
Show Answer
The object represented by the steeper line is moving faster because it has a greater slope, which means a larger velocity.
Common Position–Time Graphs and What They Mean
Once the axes and slope of a position–time graph are understood, the next step is recognizing the different patterns that describe an object’s motion. The shape of an x–t graph tells a story about how the object moves. Straight lines indicate constant velocity, while curved lines show that the object’s velocity is changing.
Instead of memorizing graph shapes, learn to interpret what the slope is doing as time passes. If the slope stays constant, the velocity is constant. If the slope changes, the velocity is changing.

Horizontal Line
A horizontal line means the object’s position does not change with time. Since the slope is zero, the object remains at rest.
Straight Upward Line
An upward straight line has a constant positive slope, indicating constant positive velocity.
Straight Downward Line
A downward straight line has a constant negative slope, indicating constant negative velocity.
Curve That Gets Steeper
As the slope increases, the object’s speed increases. This represents positive acceleration.
Curve That Flattens
As the slope decreases, the object’s speed decreases. This represents negative acceleration.
Turning Point
When the graph reaches a maximum or minimum point, the slope becomes zero for an instant. The object stops momentarily before changing direction.
Reading Strategy
- Look at the slope, not the height of the graph.
- If the slope is constant, the velocity is constant.
- If the slope changes, the velocity changes.
- A horizontal tangent means the velocity is zero at that instant.
AP Exam Tip
The AP Physics exam often presents several position–time graphs and asks which one matches a verbal description of motion. Rather than memorizing shapes, describe what happens to the slope as you move from left to right across the graph.
Common Mistake
A curved position–time graph does not necessarily mean the object follows a curved path. It simply means the object’s velocity is changing with time.
Concept Check
An object’s position–time graph starts as a straight line and gradually becomes steeper. Is the object moving with constant velocity or accelerating?
Show Answer
The object is accelerating. Since the slope increases with time, the velocity is increasing.
Velocity–Time (v–t) Graphs
A velocity–time graph, or v–t graph, shows how an object’s velocity changes as time passes. Unlike a position–time graph, which tells where an object is located, a velocity–time graph describes how fast the object is moving and in which direction.
Each point on the graph represents the object’s velocity at a particular instant. Positive values indicate motion in the positive direction, negative values indicate motion in the opposite direction, and a velocity of zero means the object is momentarily at rest.
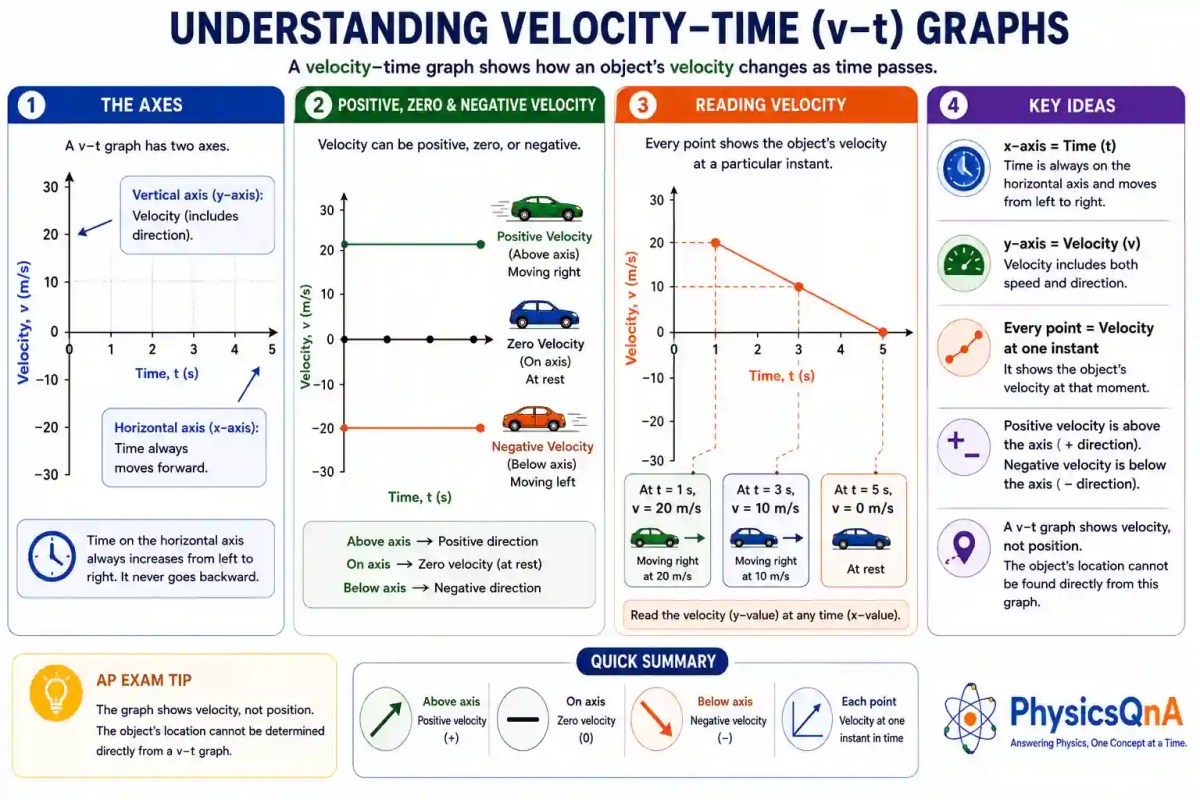
How to Read a v–t Graph
- Horizontal axis (x-axis): Time (t)
- Vertical axis (y-axis): Velocity (v)
- Above the time axis: Positive velocity
- On the time axis: Zero velocity
- Below the time axis: Negative velocity
Real-World Example
Imagine checking the speedometer of a car every second during a journey. Plotting those velocity readings against time produces a velocity–time graph. This graph clearly shows whether the car is maintaining its speed, accelerating, slowing down, or reversing direction.
Common Mistake
Do not confuse a velocity–time graph with a position–time graph. A point at 20 m/s does not mean the object is 20 meters away—it means the object is moving at a velocity of 20 meters per second at that instant.
Concept Check
An object has a velocity of −15 m/s at t = 4 s. Where would this point appear on a velocity–time graph?
- Above the time axis
- On the time axis
- Below the time axis
- Cannot be represented
Show Answer
Answer: C. A negative velocity is plotted below the time axis because it represents motion in the negative direction.
Slope of a Velocity–Time Graph = Acceleration
The most important feature of a velocity–time (v–t) graph is its slope. The slope shows how quickly an object’s velocity changes with time, which is the definition of acceleration.
If the velocity changes rapidly, the graph has a steep slope, indicating a large acceleration. If the graph is horizontal, the velocity remains constant and the acceleration is zero.

Acceleration from the Slope
![\[ a=\frac{\Delta v}{\Delta t} \]](https://i0.wp.com/physicsqanda.com/wp-content/ql-cache/quicklatex.com-c2fee340405fac95935b21701cc2ff8c_l3.png?resize=60%2C38&ssl=1 "Rendered by QuickLaTeX.com")
where Δv is the change in velocity and Δt is the corresponding change in time.
Positive Slope
An upward-sloping line means the object’s velocity increases with time. The object has a positive acceleration.
Zero Slope
A horizontal line means the velocity stays constant. Since the velocity does not change, the acceleration is zero.
Negative Slope
A downward-sloping line means the object’s velocity decreases with time. The object has a negative acceleration.
Steeper Lines
The steeper the graph, the greater the magnitude of the acceleration. A gentle slope represents a smaller acceleration.
AP Exam Tip
Do not confuse a horizontal velocity–time graph with an object at rest. A horizontal line above or below the time axis represents constant velocity, while only a horizontal line on the time axis represents zero velocity.
Common Mistake
Students often think a line above the time axis means acceleration. In reality, acceleration depends on the slope, not on how high the graph is above the axis.
Concept Check
A velocity–time graph is a straight horizontal line at 15 m/s. What is the object’s acceleration?
Show Answer
The acceleration is 0 m/s² because the slope of a horizontal velocity–time graph is zero.
Area Under a Velocity–Time Graph = Displacement
While the slope of a velocity–time graph gives acceleration, the area under the graph gives another important quantity: displacement. Instead of measuring how quickly velocity changes, the shaded region between the graph and the time axis represents how far the object moves, taking direction into account.
The area can often be calculated using simple geometric shapes such as rectangles, triangles, or trapezoids. On the AP Physics exam, recognizing these shapes can save valuable time during calculations.

Finding Displacement from Area
- Rectangle: Area = base × height
- Triangle: Area = ½ × base × height
- Trapezoid: Area = ½(a + b)h
- Total Displacement: Sum of all signed areas
Area Above the Time Axis
A shaded region above the time axis represents positive displacement. The object moves in the positive direction.
Area Below the Time Axis
A shaded region below the time axis represents negative displacement. The object moves in the negative direction.
Mixed Areas
If a graph contains regions both above and below the time axis, add the positive areas and subtract the negative areas to find the net displacement.
Distance vs. Displacement
Displacement is the signed area under the graph. Distance traveled is found by adding the magnitudes of every shaded region, regardless of whether it lies above or below the axis.
AP Exam Tip
The AP Physics exam frequently asks for distance traveled when a velocity–time graph crosses the time axis. Remember that distance is always positive, while displacement keeps track of direction.
Common Mistake
Students often subtract negative areas when calculating distance traveled. This is incorrect. For distance, use the absolute value of every area before adding them together.
Concept Check
A velocity–time graph is a rectangle with a height of 4 m/s and a width of 5 s. What is the displacement?
Show Answer
Area = base × height = (5 s)(4 m/s) = 20 m.
Common Velocity–Time Graphs and What They Mean
Just as the shape of a position–time graph reveals how an object moves, the shape of a velocity–time graph provides valuable information about an object’s velocity and acceleration. By recognizing common graph patterns, many AP Physics questions can be answered without lengthy calculations.
Focus on two features: the height of the graph, which gives the velocity, and the slope of the graph, which gives the acceleration. Together, these describe how the object’s motion changes over time.

Horizontal Line Above the Axis
The object moves with a constant positive velocity. Since the slope is zero, the acceleration is also zero.
Horizontal Line Below the Axis
The object moves with a constant negative velocity. Although the velocity is negative, the acceleration remains zero because the slope is horizontal.
Upward-Sloping Line
The object’s velocity increases with time. A constant positive slope indicates constant positive acceleration.
Downward-Sloping Line
The object’s velocity decreases with time. A constant negative slope represents constant negative acceleration.
Graph Crossing the Time Axis
When the graph crosses the time axis, the velocity changes sign. The object reverses its direction of motion.
Curved Velocity–Time Graph
A curved graph means the slope is changing continuously, so the acceleration is not constant. This represents non-uniform acceleration.
Reading Strategy
- Height of the graph → Velocity
- Slope of the graph → Acceleration
- Horizontal graph → Zero acceleration
- Crossing the axis → Direction changes
- Curved graph → Variable acceleration
AP Exam Tip
Many AP Physics questions combine several graph segments. Analyze each segment separately before determining the object’s overall motion.
Common Mistake
A graph below the time axis does not necessarily indicate deceleration. It simply means the object has a negative velocity. Whether it is speeding up or slowing down depends on both the velocity and the acceleration.
Concept Check
A velocity–time graph is a straight line that rises from −5 m/s to +10 m/s. What important event occurs when the graph crosses the time axis?
Show Answer
The object’s velocity becomes zero momentarily and then changes sign, indicating that it reverses direction.
Worked AP Physics Examples
The best way to master motion graphs is to solve problems that require interpreting the graph rather than memorizing formulas. The examples below demonstrate the most common graph questions encountered in AP Physics 1.
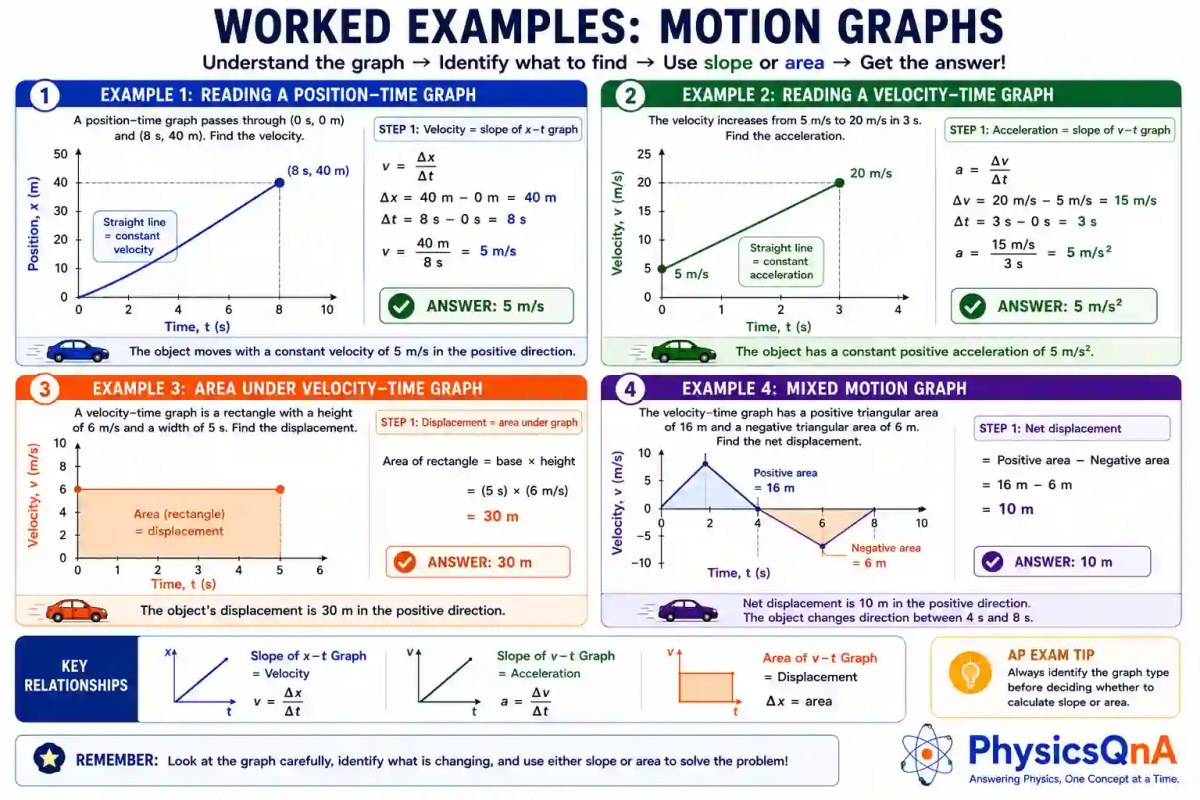
Example 1 — Finding Velocity from a Position–Time Graph
Question: A position–time graph passes through (0 s, 0 m) and (8 s, 40 m). Determine the object’s velocity.
Solution:
![\[ v=\frac{\Delta x}{\Delta t} =\frac{40\text{ m}}{8\text{ s}} =5\text{ m/s} \]](https://i0.wp.com/physicsqanda.com/wp-content/ql-cache/quicklatex.com-35f84e9841882093124381cbdb2f526c_l3.png?resize=197%2C38&ssl=1 "Rendered by QuickLaTeX.com")
Answer: 5 m/s
Example 2 — Finding Acceleration from a Velocity–Time Graph
Question: The velocity increases from 5 m/s to 20 m/s in 3 s. Determine the acceleration.
![\[ a=\frac{\Delta v}{\Delta t} =\frac{20-5}{3} =5\text{ m/s}^2 \]](https://i0.wp.com/physicsqanda.com/wp-content/ql-cache/quicklatex.com-dc380ccfd2f8f5729607f6c75f8cb7c1_l3.png?resize=213%2C38&ssl=1 "Rendered by QuickLaTeX.com")
Answer: 5 m/s²
Example 3 — Finding Displacement from Area
Question: A velocity–time graph is a rectangle with a height of 6 m/s and a width of 5 s.
![\[ \text{Displacement} =6\times5 =30\text{ m} \]](https://i0.wp.com/physicsqanda.com/wp-content/ql-cache/quicklatex.com-5faed0b212be4f9da527d3ac459a5d5b_l3.png?resize=229%2C17&ssl=1 "Rendered by QuickLaTeX.com")
Answer: 30 m
Example 4 — Mixed Motion Graph
Question: A velocity–time graph contains a positive triangular area of 16 m and a negative triangular area of 6 m. Determine the net displacement.
![\[ 16-6=10\text{ m} \]](https://i0.wp.com/physicsqanda.com/wp-content/ql-cache/quicklatex.com-c48339184e9cd6575aab5e603b4587a9_l3.png?resize=109%2C12&ssl=1 "Rendered by QuickLaTeX.com")
Answer: 10 m
AP Exam Strategy
Before performing any calculation, identify the graph type. For a position–time graph, calculate the slope to find velocity. For a velocity–time graph, calculate the slope to find acceleration or the area to find displacement.
AP Physics Practice Problems
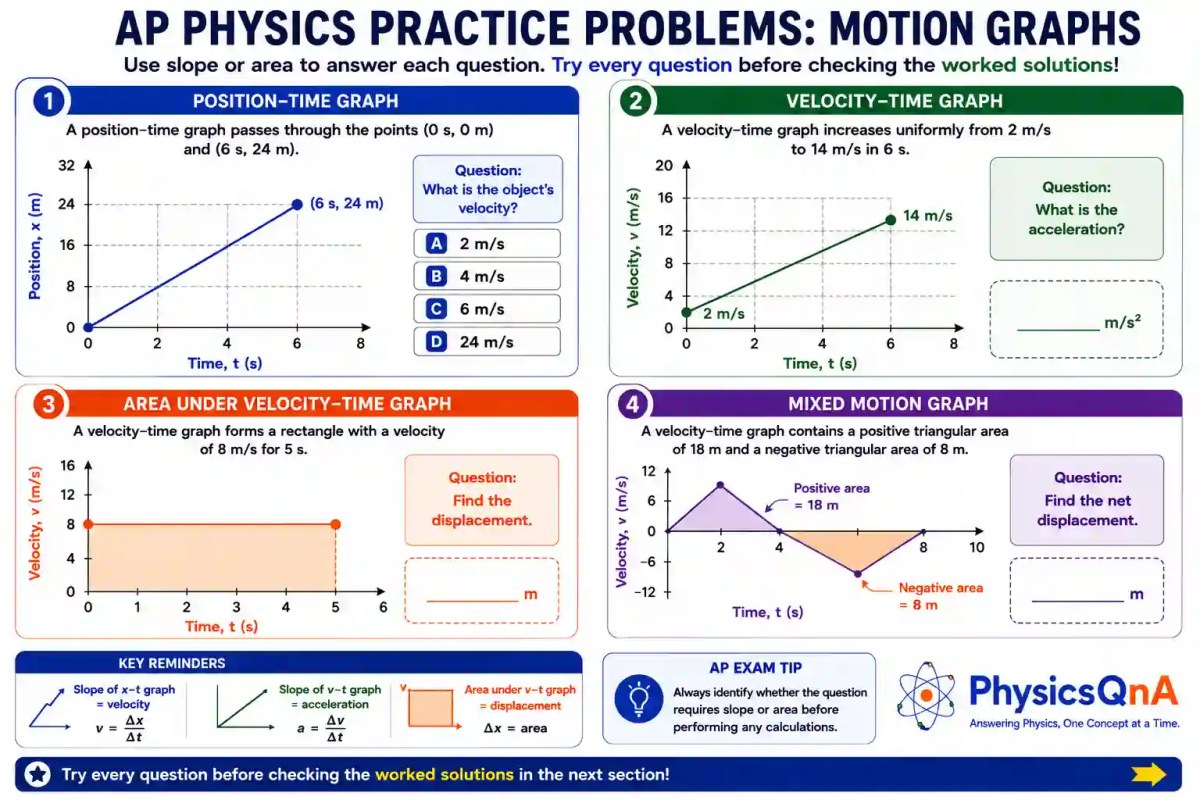
Test your understanding of motion graphs by solving the following AP-style questions. Try to complete each problem without looking at the worked examples. The fully worked solutions are provided in the next section.
Question 1
A position–time graph passes through the points (0 s, 0 m) and (6 s, 24 m). What is the object’s velocity?
- 2 m/s
- 4 m/s
- 6 m/s
- 24 m/s
Question 2
A velocity–time graph increases uniformly from 2 m/s to 14 m/s in 6 s. Determine the acceleration.
Question 3
A velocity–time graph forms a rectangle with a velocity of 8 m/s for 5 s. Calculate the displacement.
Question 4
A velocity–time graph contains a positive triangular area of 18 m and a negative triangular area of 8 m. Determine the net displacement.
AP Exam Strategy
Before writing any equation, identify the graph type. Then decide whether the problem requires finding a slope or calculating an area. This simple habit helps avoid the most common graph-analysis mistakes.
Fully Worked Solutions
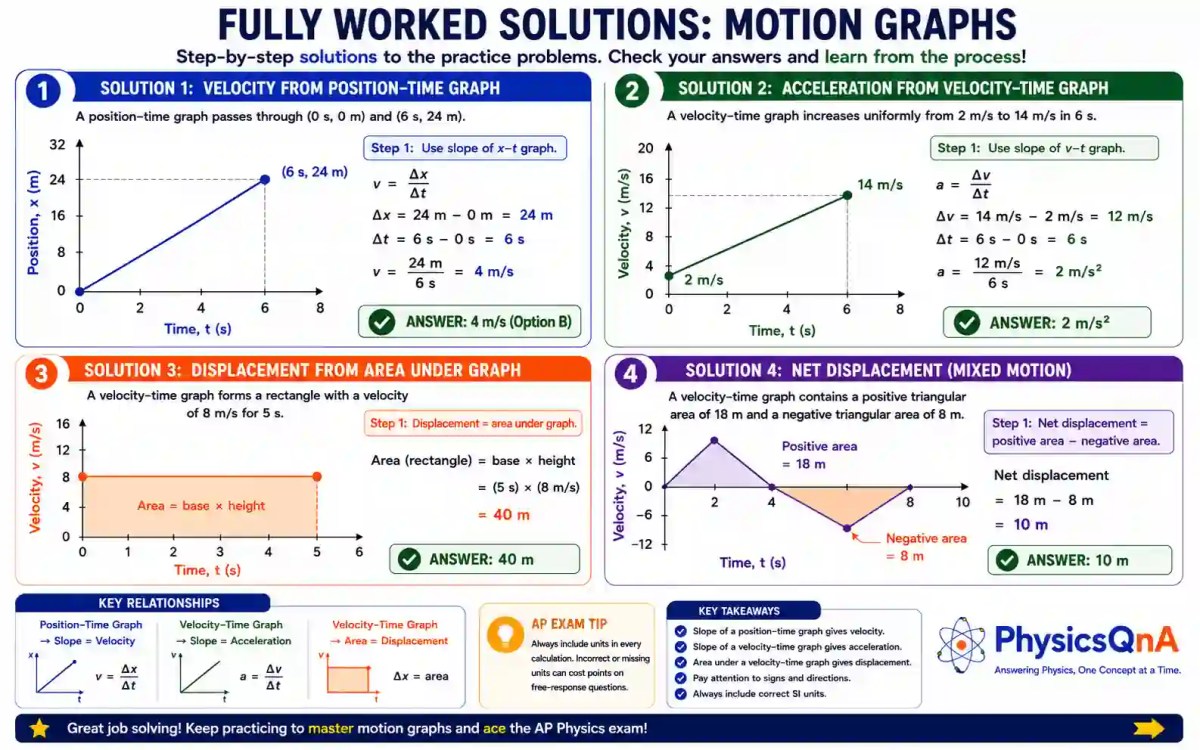
Check your answers only after attempting the practice problems. Compare your reasoning with the step-by-step solutions below to identify any mistakes and strengthen your graph interpretation skills.
Solution 1 — Velocity from a Position–Time Graph
![\[ v=\frac{\Delta x}{\Delta t} =\frac{24\text{ m}}{6\text{ s}} =4\text{ m/s} \]](https://i0.wp.com/physicsqanda.com/wp-content/ql-cache/quicklatex.com-27b5d715ae9e294160baf29289a7095a_l3.png?resize=197%2C38&ssl=1 "Rendered by QuickLaTeX.com")
Answer: 4 m/s (Option B)
Solution 2 — Acceleration from a Velocity–Time Graph
![\[ a=\frac{\Delta v}{\Delta t} =\frac{14-2}{6} =2\text{ m/s}^2 \]](https://i0.wp.com/physicsqanda.com/wp-content/ql-cache/quicklatex.com-4e8a1bcafab5df6cf11739a6d7ba67e0_l3.png?resize=213%2C38&ssl=1 "Rendered by QuickLaTeX.com")
Answer: 2 m/s²
Solution 3 — Displacement from Area
![\[ \text{Displacement} =5\times8 =40\text{ m} \]](https://i0.wp.com/physicsqanda.com/wp-content/ql-cache/quicklatex.com-db7e93a96c1eb37e1ceb54b34a6a254a_l3.png?resize=229%2C17&ssl=1 "Rendered by QuickLaTeX.com")
Answer: 40 m
Solution 4 — Net Displacement
![\[ 18-8=10\text{ m} \]](https://i0.wp.com/physicsqanda.com/wp-content/ql-cache/quicklatex.com-f932e1884c4f150be0950f801e63b05e_l3.png?resize=109%2C12&ssl=1 "Rendered by QuickLaTeX.com")
Answer: 10 m
Key Takeaways
- Position–time graph → Slope gives velocity.
- Velocity–time graph → Slope gives acceleration.
- Velocity–time graph → Area gives displacement.
- Always include correct SI units in every answer.
AP Exam Tip
Before using a formula, identify whether the graph is showing position or velocity. This single step prevents the most common graph-analysis errors on AP Physics exams.
Common Motion Graph Mistakes to Avoid
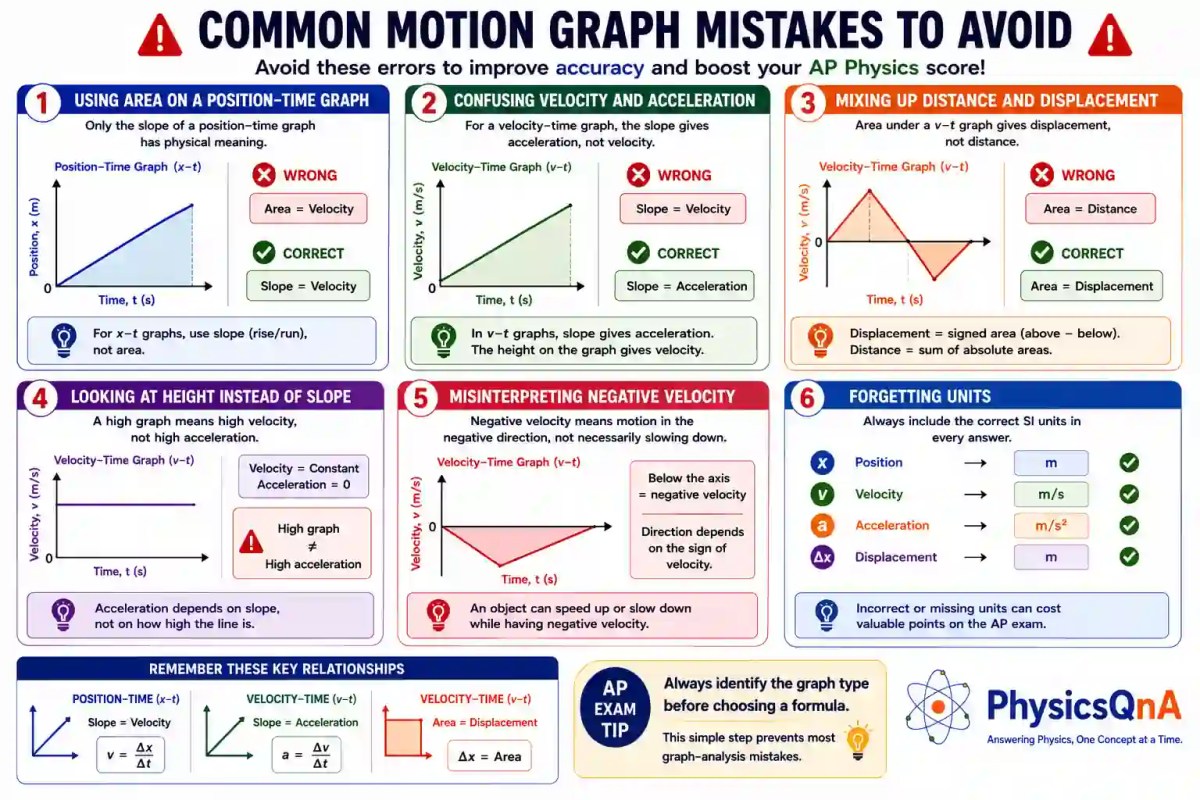
Many errors on AP Physics exams occur because students apply the correct formula to the wrong type of graph. Learning to recognize these common mistakes will improve both speed and accuracy during the exam.
1. Using Area on a Position–Time Graph
Only the slope of a position–time graph has physical meaning. The area under a position–time graph is not used to calculate velocity or displacement in AP Physics.
2. Confusing Velocity and Acceleration
For a velocity–time graph, the slope gives acceleration, not velocity. The graph’s height gives the velocity.
3. Mixing Up Distance and Displacement
The signed area under a velocity–time graph gives displacement. To calculate distance traveled, add the magnitudes of every area, regardless of whether it lies above or below the time axis.
4. Looking at Height Instead of Slope
A graph high above the time axis represents a large velocity, not a large acceleration. Acceleration depends only on the graph’s slope.
5. Misinterpreting Negative Velocity
Negative velocity simply means motion in the negative direction. It does not automatically mean the object is slowing down.
6. Forgetting Units
Always include the correct SI units: m for position and displacement, m/s for velocity, and m/s² for acceleration.
AP Exam Tip
Before solving any graph question, ask two questions: What type of graph is this? and Does this problem require a slope or an area? This simple habit prevents the majority of graph-analysis mistakes.
Motion Graph Cheat Sheet
Use this one-page summary for quick revision before quizzes, tests, and the AP Physics 1 exam. It highlights the essential ideas, formulas, graph interpretations, and exam strategies from this lesson.
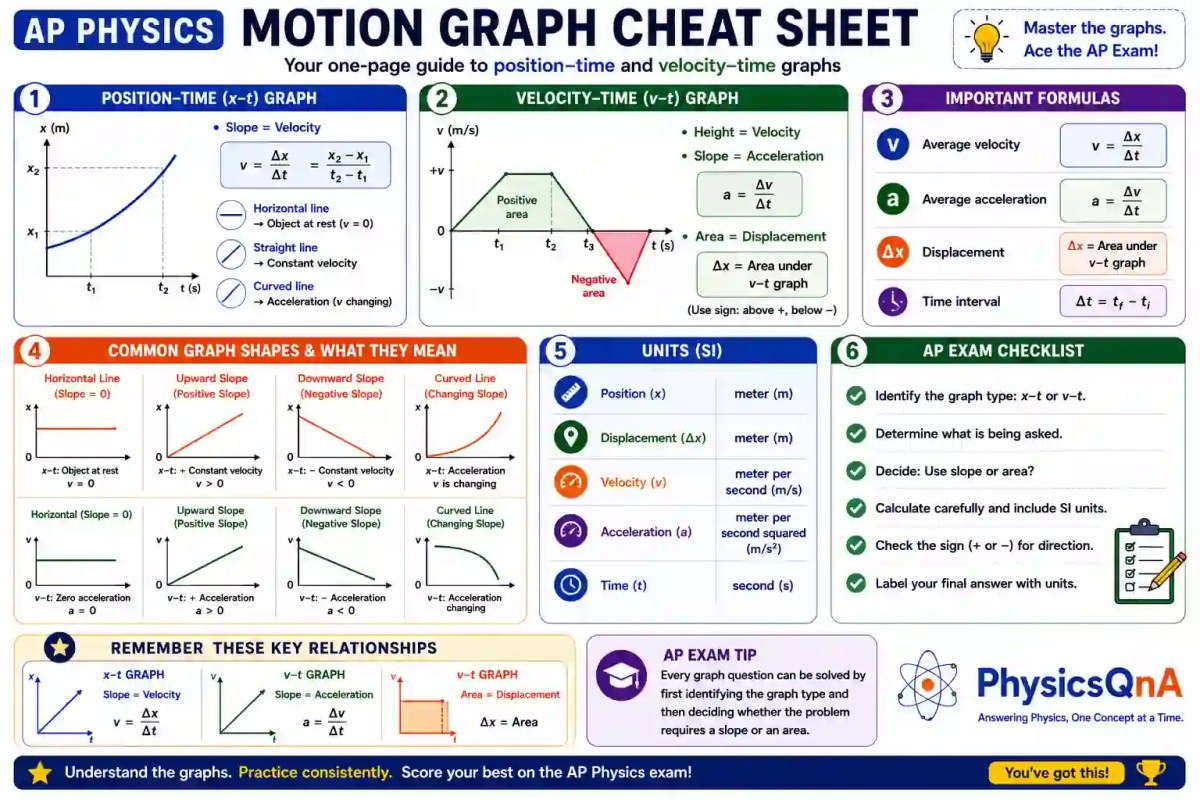
Essential Relationships
- Position–Time Graph: Slope = Velocity
- Velocity–Time Graph: Height = Velocity
- Velocity–Time Graph: Slope = Acceleration
- Velocity–Time Graph: Area = Displacement
Key Formulas
![\[ \Delta x=\text{Area under the }v\text{-}t\text{ graph} \]](https://i0.wp.com/physicsqanda.com/wp-content/ql-cache/quicklatex.com-52df5cc4beedc26052b1c8b8e7b832b4_l3.png?resize=245%2C17&ssl=1 "Rendered by QuickLaTeX.com")
SI Units
- Position: m
- Displacement: m
- Velocity: m/s
- Acceleration: m/s²
- Time: s
AP Exam Checklist
- ✔ Identify the graph type.
- ✔ Decide whether to calculate a slope or an area.
- ✔ Include SI units.
- ✔ Check the sign of velocity or displacement.
- ✔ Clearly label the final answer.
Final Reminder
Before solving any graph problem, determine whether the graph is position–time or velocity–time. This single decision tells you which quantity to calculate and prevents the most common exam mistakes.
Frequently Asked Questions (FAQ)
These frequently asked questions summarize the most important ideas about motion graphs and address common points of confusion for AP Physics 1 students.
What does the slope of a position–time graph represent?
The slope of a position–time (x–t) graph represents the object’s velocity. A steeper slope indicates a greater speed, while the sign of the slope indicates the direction of motion.
What does the slope of a velocity–time graph represent?
The slope of a velocity–time (v–t) graph represents the object’s acceleration. A positive slope indicates positive acceleration, while a negative slope indicates negative acceleration.
What does the area under a velocity–time graph represent?
The signed area between the velocity–time graph and the time axis represents the object’s displacement. Areas below the time axis contribute negative displacement.
What is the difference between distance and displacement on a velocity–time graph?
Displacement is the signed area under the graph. Distance traveled is found by adding the absolute values of all areas, regardless of whether they lie above or below the time axis.
How can acceleration be zero if the object is moving?
An object moving with a constant velocity has zero acceleration because its velocity is not changing. On a velocity–time graph, this appears as a horizontal line above or below the time axis.
Does a graph below the time axis mean the object is slowing down?
No. A graph below the time axis simply indicates a negative velocity. Whether the object is speeding up or slowing down depends on both the velocity and the acceleration.
How do I know whether to calculate slope or area?
First identify the graph type.
- Position–Time Graph: Calculate the slope to find velocity.
- Velocity–Time Graph: Calculate the slope to find acceleration.
- Velocity–Time Graph: Calculate the area to find displacement.
How are motion graph questions asked on the AP Physics exam?
Most AP Physics questions require interpreting the graph rather than memorizing formulas. Students are commonly asked to determine velocity, acceleration, displacement, direction of motion, or compare multiple graph segments.
What are the SI units used in motion graphs?
The standard SI units are:
- Position: meter (m)
- Displacement: meter (m)
- Velocity: meter per second (m/s)
- Acceleration: meter per second squared (m/s²)
- Time: second (s)
What is the fastest way to solve motion graph questions?
Follow these four steps:
- Identify the graph type.
- Determine whether the question requires a slope or an area.
- Perform the calculation with correct SI units.
- Check whether the answer should be positive or negative.
Lesson Summary
Motion graphs provide a visual way to describe how an object’s position, velocity, and acceleration change over time. Instead of relying only on equations, they allow you to understand motion by interpreting graph shapes, slopes, and areas. Mastering these ideas is essential for success in AP Physics 1 because graph interpretation is tested throughout the course and frequently appears on both multiple-choice and free-response questions.
Key Takeaways
- Position–Time (x–t) Graph: The slope represents the object’s velocity.
- Horizontal x–t Graph: The object is at rest because its position does not change.
- Straight x–t Line: The object moves with constant velocity.
- Curved x–t Graph: The object’s velocity is changing, indicating acceleration.
- Velocity–Time (v–t) Graph: The graph’s height represents velocity.
- Slope of a v–t Graph: Gives the object’s acceleration.
- Area Under a v–t Graph: Gives the object’s displacement.
- Areas Above the Time Axis: Represent positive displacement.
- Areas Below the Time Axis: Represent negative displacement.
- Distance Traveled: Add the magnitudes of all areas, regardless of sign.
Motion Graph Problem-Solving Strategy
- Identify whether the graph is Position–Time or Velocity–Time.
- Determine whether the question requires a slope or an area.
- Use the correct SI units throughout the calculation.
- Check the sign of the answer to account for direction.
- Review whether the result is physically reasonable before submitting your answer.
Final AP Exam Advice
Do not memorize graph shapes without understanding what they represent. Every motion graph question can be solved by asking two simple questions:
- What type of graph is this?
- Should I calculate a slope or an area?
Answering these questions first will guide you toward the correct method and help avoid the most common mistakes on the AP Physics exam.
One-Minute Revision
| Graph | Slope | Area |
|---|---|---|
| Position–Time (x–t) | Velocity | Not Used |
| Velocity–Time (v–t) | Acceleration | Displacement |
After completing this lesson, you should be able to confidently interpret position–time and velocity–time graphs, calculate velocity, acceleration, and displacement from graphical data, recognize common graph shapes, and solve AP Physics motion graph questions using both slope and area methods.